#bigdata machinelearning
Explore tagged Tumblr posts
Visit Tumblr Blog
Explore Tumblr blogs with no restrictions, modern design and the best experience.
Last Seen Tumblr Blogs


Fun Fact
In 2020, 27% of US Tumblr users had an annual household income of over $100,000.
Text
Empower your business with data-driven decisions! Big Data Analysis and Machine Learning unlock insights, optimize processes, and drive innovation, ensuring you stay ahead in the digital era.

Transform raw data into powerful insights! Big Data and Machine Learning help businesses predict trends, automate workflows, and make smarter decisions for a future-ready workforce.
#bigdataanalytics#machinelearning#machinelearningalgorithms#bigdata#analytics#zitintech#zitintechnologies#itjob#jobs#hiring#workforcedevelopment#recruiting#laboursupply#technologynews#workforce#workfromhome#training#workforcesolutions#it#software#technology#itstaffing#job
8 notes
·
View notes
Text
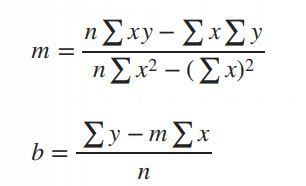
Simple Linear Regression in Data Science and machine learning
Simple linear regression is one of the most important techniques in data science and machine learning. It is the foundation of many statistical and machine learning models. Even though it is simple, its concepts are widely applicable in predicting outcomes and understanding relationships between variables.
This article will help you learn about:
1. What is simple linear regression and why it matters.
2. The step-by-step intuition behind it.
3. The math of finding slope() and intercept().
4. Simple linear regression coding using Python.
5. A practical real-world implementation.
If you are new to data science or machine learning, don’t worry! We will keep things simple so that you can follow along without any problems.
What is simple linear regression?
Simple linear regression is a method to model the relationship between two variables:
1. Independent variable (X): The input, also called the predictor or feature.
2. Dependent Variable (Y): The output or target value we want to predict.
The main purpose of simple linear regression is to find a straight line (called the regression line) that best fits the data. This line minimizes the error between the actual and predicted values.
The mathematical equation for the line is:
Y = mX + b
: The predicted values.
: The slope of the line (how steep it is).
: The intercept (the value of when).
Why use simple linear regression?
click here to read more https://datacienceatoz.blogspot.com/2025/01/simple-linear-regression-in-data.html
#artificial intelligence#bigdata#books#machine learning#machinelearning#programming#python#science#skills#big data#linear algebra#linear b#slope#interception
6 notes
·
View notes
Text
What happens when human imagination meets machine intelligence? An algorithm can reproduce, at scale, every brushstroke, sculpted curve, and poetic phrase.
Who Can You Trust When Creativity Is Algorithmic? Algorithmic Authenticity. How AI artists can copyright their work
#machinelearning#artificialintelligence#art#digitalart#mlart#ai#algorithm#bigdata#datascience#vr#ai art#authenticity#copyright
9 notes
·
View notes
Text

Robotic Process Automation (RPA) enhances business efficiency by automating repetitive tasks, freeing up employees for more strategic work. It improves accuracy, reduces operational costs, and boosts productivity across industries.
#artificialintelligence#ai#machinelearning#aiart#digitalart#technology#art#aiartcommunity#midjourney#datascience#generativeart#innovation#tech#deeplearning#python#midjourneyart#aiartwork#aiartist#programming#robotics#bigdata#artoftheday#coding#aiartists#digitalartist#business#iot#midjourneyai#artwork#stablediffusion
3 notes
·
View notes
Text
𝐓𝐨𝐩 5 𝐌𝐮𝐬𝐭-𝐊𝐧𝐨𝐰 𝐃𝐚𝐭𝐚 𝐒𝐜𝐢𝐞𝐧𝐜𝐞 𝐓𝐨𝐨𝐥𝐬 – 2025 𝐄𝐝𝐢𝐭𝐢𝐨𝐧!
Looking to level up your data science skills? These 5 must-know tools are essential for every data scientist in 2025! From data wrangling to machine learning, these tools will take your projects to the next level. 💡📊
Watch - https://youtube.com/shorts/n-hNExa09sI
Which data science tool do YOU swear by? Drop your thoughts below! ⬇️
🔔 Subscribe for more data science tips & trends!
#DataScienceTools#DataScience#MachineLearning#AI#DataAnalytics#TechTools#DataVisualization#BigData#DataAnalysis#TechTrends
2 notes
·
View notes
Text

Wielding Big Data Using PySpark
Introduction to PySpark
PySpark is the Python API for Apache Spark, a distributed computing framework designed to process large-scale data efficiently. It enables parallel data processing across multiple nodes, making it a powerful tool for handling massive datasets.
Why Use PySpark for Big Data?
Scalability: Works across clusters to process petabytes of data.
Speed: Uses in-memory computation to enhance performance.
Flexibility: Supports various data formats and integrates with other big data tools.
Ease of Use: Provides SQL-like querying and DataFrame operations for intuitive data handling.
Setting Up PySpark
To use PySpark, you need to install it and set up a Spark session. Once initialized, Spark allows users to read, process, and analyze large datasets.
Processing Data with PySpark
PySpark can handle different types of data sources such as CSV, JSON, Parquet, and databases. Once data is loaded, users can explore it by checking the schema, summary statistics, and unique values.
Common Data Processing Tasks
Viewing and summarizing datasets.
Handling missing values by dropping or replacing them.
Removing duplicate records.
Filtering, grouping, and sorting data for meaningful insights.
Transforming Data with PySpark
Data can be transformed using SQL-like queries or DataFrame operations. Users can:
Select specific columns for analysis.
Apply conditions to filter out unwanted records.
Group data to find patterns and trends.
Add new calculated columns based on existing data.
Optimizing Performance in PySpark
When working with big data, optimizing performance is crucial. Some strategies include:
Partitioning: Distributing data across multiple partitions for parallel processing.
Caching: Storing intermediate results in memory to speed up repeated computations.
Broadcast Joins: Optimizing joins by broadcasting smaller datasets to all nodes.
Machine Learning with PySpark
PySpark includes MLlib, a machine learning library for big data. It allows users to prepare data, apply machine learning models, and generate predictions. This is useful for tasks such as regression, classification, clustering, and recommendation systems.
Running PySpark on a Cluster
PySpark can run on a single machine or be deployed on a cluster using a distributed computing system like Hadoop YARN. This enables large-scale data processing with improved efficiency.
Conclusion
PySpark provides a powerful platform for handling big data efficiently. With its distributed computing capabilities, it allows users to clean, transform, and analyze large datasets while optimizing performance for scalability.
For Free Tutorials for Programming Languages Visit-https://www.tpointtech.com/
2 notes
·
View notes
Text

Acadecraft Partners with Wadhwani Foundation's Government Digital Transformation Initiative to Develop eLearning Courses
#digitaltransformation#technology#innovation#business#digitalmarketing#ai#digital#artificialintelligence#software#machinelearning#automation#businessgrowth#tech#iot#techinnovation#bigdata#cybersecurity#cloud#data#cloudcomputing#smallbusiness#customerexperience#marketing#sap#webdevelopment#erp#blockchain#analytics#ecommerce#datascience
2 notes
·
View notes
Text

DeepSeek: The Chinese AI Company Challenging OpenAI, read more
#DeepSeek#AI#ArtificialIntelligence#DeepLearning#MachineLearning#TechInnovation#AIResearch#FutureOfAI#NeuralNetworks#BigData#AIAutomation#SmartTechnology#DataScience#AIAlgorithms#TechRevolution#FutureTechnology#AITools#AIExploration
3 notes
·
View notes
Text
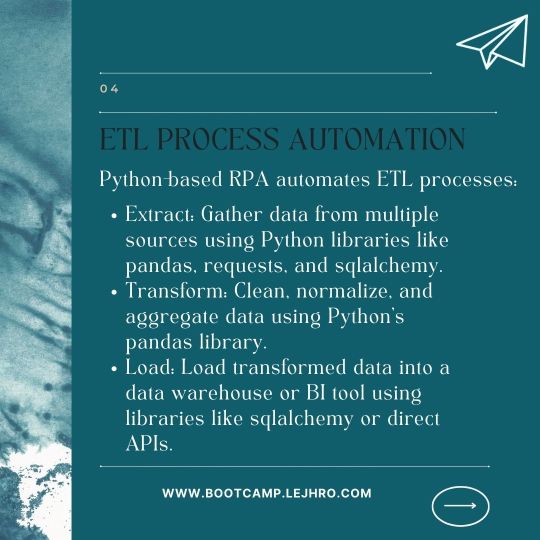
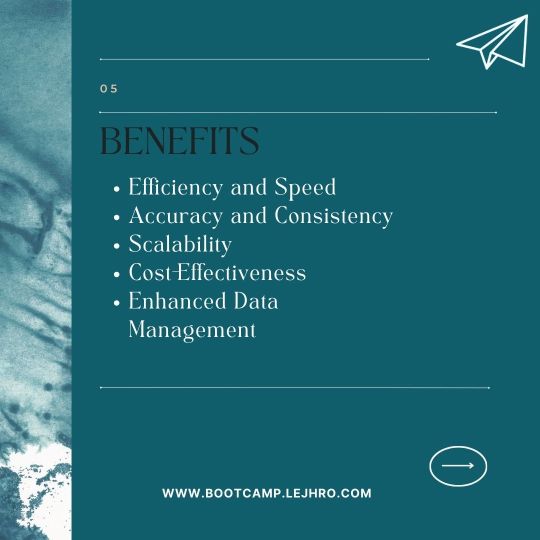


🚀 Revolutionize Your Data Management! 🚀 Discover how Python-based RPA integration with BI tools can automate ETL processes, increasing efficiency, accuracy, and scalability. Learn how businesses like yours are leveraging this technology to drive data-driven decision-making. 💡Learn More: https://lnkd.in/giV6BPNQ The latest scoop, straight to your mailbox : http://surl.li/omuvuv #DataManagement #ETL #RPA #BI #Automation #DigitalTransformation #DataAnalytics #BusinessIntelligence #TechnologyInnovation #DataScience #Innovation #BusinessSolutions #DataProcessing #SoftwareDevelopment #DataVisualization #Analytics
3 notes
·
View notes
Text

Growth is exciting, but only if your app can handle it! Cloud technology ensures your app scales effortlessly to meet increasing demand. 📈 Get ready for success! 🔗Learn more: https://greyspacecomputing.com/custom-mobile-application-development-services/ 📧 Visit: https://greyspacecomputing.com/portfolio
#GreySpaceComputing#CloudTech#AppScalability#cloudcomputing#cloud#technology#cybersecurity#aws#bigdata#devops#it#datacenter#azure#cloudstorage#linux#programming#software#tech#iot#cloudservices#coding#cloudsecurity#machinelearning#informationtechnology#datascience#business#python#security#microsoft#dataprotection
2 notes
·
View notes
Text
Google Cloud Professional Cloud Architect Certification. Become a GCP Cloud Architect, Latest GCP Exam and Case Studies.
Google Cloud Platform is one of the fastest-growing cloud service platforms offered today that lets you run your applications and data workflows at a 'Google-sized' scale.
Google Cloud Certified Professional Cloud Architect certification is one of the most highly desired IT certifications out today. It is also one of the most challenging exams offered by any cloud vendor today. Passing this exam will take many hours of study, hands-on experience, and an understanding of a very wide range of GCP topics.
Luckily, we're here to help you out! This course is designed to be your best single resource to prepare for and pass the exam to become a certified Google Cloud Architect.
Why should do a Google Cloud Certification?
Here are few results from Google's 2020 Survey:
89% of Google Cloud certified individuals are more confident about their cloud skills
GCP Cloud Architect was the highest paying certification of 2020 (2) and 2019 (3)
More than 1 in 4 of Google Cloud certified individuals took on more responsibility or leadership roles at work
Why should you aim for Google Cloud - GCP Cloud Architect Certification?
Google Cloud Professional Cloud Architect certification helps you gain an understanding of cloud architecture and Google Cloud Platform.
As a Cloud Architect, you will learn to design, develop, and manage robust, secure, scalable, highly available, and dynamic solutions to drive business objectives.
The Google Cloud Certified - Professional Cloud Architect exam assesses your ability to:
Design and architect a GCP solution architecture
Manage and provision the GCP solution infrastructure
Design for security and compliance
Analyze and optimize technical and business processes
Manage implementations of Google Cloud architecture
Ensure solution and operations reliability
Are you ready to get started on this amazing journey to becoming a Google Cloud Architect?
So let's get started!
Who this course is for:
You want to start your Cloud Journey with Google Cloud Platform
You want to become a Google Cloud Certified Professional Cloud Architect
#googlecloud#aws#cloud#cloudcomputing#azure#google#googlepixel#technology#machinelearning#awscloud#devops#bigdata#python#coding#googlecloudplatform#cybersecurity#gcp#developer#microsoft#linux#datascience#tech#microsoftazure#programming#amazonwebservices#amazon#software#pixel#xl#azurecloud
5 notes
·
View notes
Text
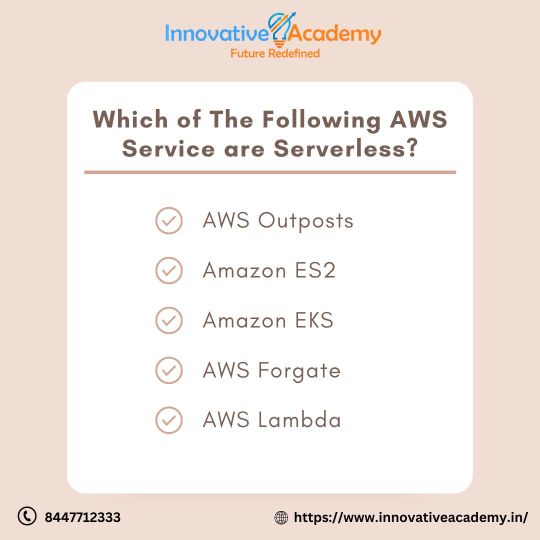
Quiz Time
Visit: https://innovativeacademy.in Call us: +91 8447712333
#InnovativeAcademy#microsoftcertifications#linux#linuxcertifications#cloudcomputing#awscloud#ccnacertifications#cybersecurity#coding#developer#RedHatTraining#redhatlinux#machinelearning#bigdata#googlecloud#iot#software#java#awstraining#ccna#javascript#gcp#security#CCNAQuiz#CISCO#Network#Microsoft#itcourses#quiz
2 notes
·
View notes
Text
Understanding Outliers in Machine Learning and Data Science

In machine learning and data science, an outlier is like a misfit in a dataset. It's a data point that stands out significantly from the rest of the data. Sometimes, these outliers are errors, while other times, they reveal something truly interesting about the data. Either way, handling outliers is a crucial step in the data preprocessing stage. If left unchecked, they can skew your analysis and even mess up your machine learning models.
In this article, we will dive into:
1. What outliers are and why they matter.
2. How to detect and remove outliers using the Interquartile Range (IQR) method.
3. Using the Z-score method for outlier detection and removal.
4. How the Percentile Method and Winsorization techniques can help handle outliers.
This guide will explain each method in simple terms with Python code examples so that even beginners can follow along.
1. What Are Outliers?
An outlier is a data point that lies far outside the range of most other values in your dataset. For example, in a list of incomes, most people might earn between $30,000 and $70,000, but someone earning $5,000,000 would be an outlier.
Why Are Outliers Important?
Outliers can be problematic or insightful:
Problematic Outliers: Errors in data entry, sensor faults, or sampling issues.
Insightful Outliers: They might indicate fraud, unusual trends, or new patterns.
Types of Outliers
1. Univariate Outliers: These are extreme values in a single variable.
Example: A temperature of 300°F in a dataset about room temperatures.
2. Multivariate Outliers: These involve unusual combinations of values in multiple variables.
Example: A person with an unusually high income but a very low age.
3. Contextual Outliers: These depend on the context.
Example: A high temperature in winter might be an outlier, but not in summer.
2. Outlier Detection and Removal Using the IQR Method
The Interquartile Range (IQR) method is one of the simplest ways to detect outliers. It works by identifying the middle 50% of your data and marking anything that falls far outside this range as an outlier.
Steps:
1. Calculate the 25th percentile (Q1) and 75th percentile (Q3) of your data.
2. Compute the IQR:
{IQR} = Q3 - Q1
Q1 - 1.5 \times \text{IQR}
Q3 + 1.5 \times \text{IQR} ] 4. Anything below the lower bound or above the upper bound is an outlier.
Python Example:
import pandas as pd
# Sample dataset
data = {'Values': [12, 14, 18, 22, 25, 28, 32, 95, 100]}
df = pd.DataFrame(data)
# Calculate Q1, Q3, and IQR
Q1 = df['Values'].quantile(0.25)
Q3 = df['Values'].quantile(0.75)
IQR = Q3 - Q1
# Define the bounds
lower_bound = Q1 - 1.5 * IQR
upper_bound = Q3 + 1.5 * IQR
# Identify and remove outliers
outliers = df[(df['Values'] < lower_bound) | (df['Values'] > upper_bound)]
print("Outliers:\n", outliers)
filtered_data = df[(df['Values'] >= lower_bound) & (df['Values'] <= upper_bound)]
print("Filtered Data:\n", filtered_data)
Key Points:
The IQR method is great for univariate datasets.
It works well when the data isn’t skewed or heavily distributed.
3. Outlier Detection and Removal Using the Z-Score Method
The Z-score method measures how far a data point is from the mean, in terms of standard deviations. If a Z-score is greater than a certain threshold (commonly 3 or -3), it is considered an outlier.
Formula:
Z = \frac{(X - \mu)}{\sigma}
is the data point,
is the mean of the dataset,
is the standard deviation.
Python Example:
import numpy as np
# Sample dataset
data = {'Values': [12, 14, 18, 22, 25, 28, 32, 95, 100]}
df = pd.DataFrame(data)
# Calculate mean and standard deviation
mean = df['Values'].mean()
std_dev = df['Values'].std()
# Compute Z-scores
df['Z-Score'] = (df['Values'] - mean) / std_dev
# Identify and remove outliers
threshold = 3
outliers = df[(df['Z-Score'] > threshold) | (df['Z-Score'] < -threshold)]
print("Outliers:\n", outliers)
filtered_data = df[(df['Z-Score'] <= threshold) & (df['Z-Score'] >= -threshold)]
print("Filtered Data:\n", filtered_data)
Key Points:
The Z-score method assumes the data follows a normal distribution.
It may not work well with skewed datasets.
4. Outlier Detection Using the Percentile Method and Winsorization
Percentile Method:
In the percentile method, we define a lower percentile (e.g., 1st percentile) and an upper percentile (e.g., 99th percentile). Any value outside this range is treated as an outlier.
Winsorization:
Winsorization is a technique where outliers are not removed but replaced with the nearest acceptable value.
Python Example:
from scipy.stats.mstats import winsorize
import numpy as np
Sample data
data = [12, 14, 18, 22, 25, 28, 32, 95, 100]
Calculate percentiles
lower_percentile = np.percentile(data, 1)
upper_percentile = np.percentile(data, 99)
Identify outliers
outliers = [x for x in data if x < lower_percentile or x > upper_percentile]
print("Outliers:", outliers)
# Apply Winsorization
winsorized_data = winsorize(data, limits=[0.01, 0.01])
print("Winsorized Data:", list(winsorized_data))
Key Points:
Percentile and Winsorization methods are useful for skewed data.
Winsorization is preferred when data integrity must be preserved.
Final Thoughts
Outliers can be tricky, but understanding how to detect and handle them is a key skill in machine learning and data science. Whether you use the IQR method, Z-score, or Wins
orization, always tailor your approach to the specific dataset you’re working with.
By mastering these techniques, you’ll be able to clean your data effectively and improve the accuracy of your models.
#science#skills#programming#bigdata#books#machinelearning#artificial intelligence#python#machine learning#data centers#outliers#big data#data analysis#data analytics#data scientist#database#datascience#data
4 notes
·
View notes
Text
Code always felt like rules
Vibe coding makes it feel like jazz
How to Start Coding with Vibe. An Easy-to-Follow Guide
#machinelearning#artificialintelligence#art#digitalart#datascience#mlart#ai#algorithm#bigdata#vibe coding#vibe#coding#guide
3 notes
·
View notes
Text

We can reduce manual data entry and automate invoices by integrating OCR and AI-powered tools with your accounting system. Platforms like Odoo or QuickBooks streamline invoice generation, approval, and payment tracking with minimal human intervention.
#artificialintelligence#ai#machinelearning#aiart#digitalart#technology#art#aiartcommunity#midjourney#datascience#generativeart#innovation#tech#deeplearning#python#midjourneyart#aiartwork#aiartist#programming#robotics#bigdata#artoftheday#coding#aiartists#digitalartist#business#iot#midjourneyai#artwork#stablediffusion
2 notes
·
View notes
Text
Python for Data Science: From Beginner to Expert – A Complete Guide!
Python has become the go-to language for data science, thanks to its flexibility, powerful libraries, and strong community support. In this video, we’ll explore why Python is the best choice for data scientists and how you can master it—from setting up your environment to advanced machine learning techniques.
🔹 What You'll Learn:
✅ Why Python is essential for data science
✅ Setting up Python and key libraries (NumPy, Pandas, Matplotlib) ✅ Data wrangling, visualization, and transformation
✅ Building machine learning models with Scikit-learn
✅ Best practices to enhance your data science workflow 🚀 Whether you're a beginner or looking to refine your skills, this guide will help you level up in data science with Python. 📌 Don’t forget to like, subscribe, and hit the notification bell for more data science and Python content!
youtube
#python#datascience#machinelearning#ai#bigdata#deeplearning#technology#programming#coding#developer#pythonprogramming#pandas#numpy#matplotlib#datavisualization#ml#analytics#automation#artificialintelligence#datascientist#dataanalytics#Youtube
3 notes
·
View notes